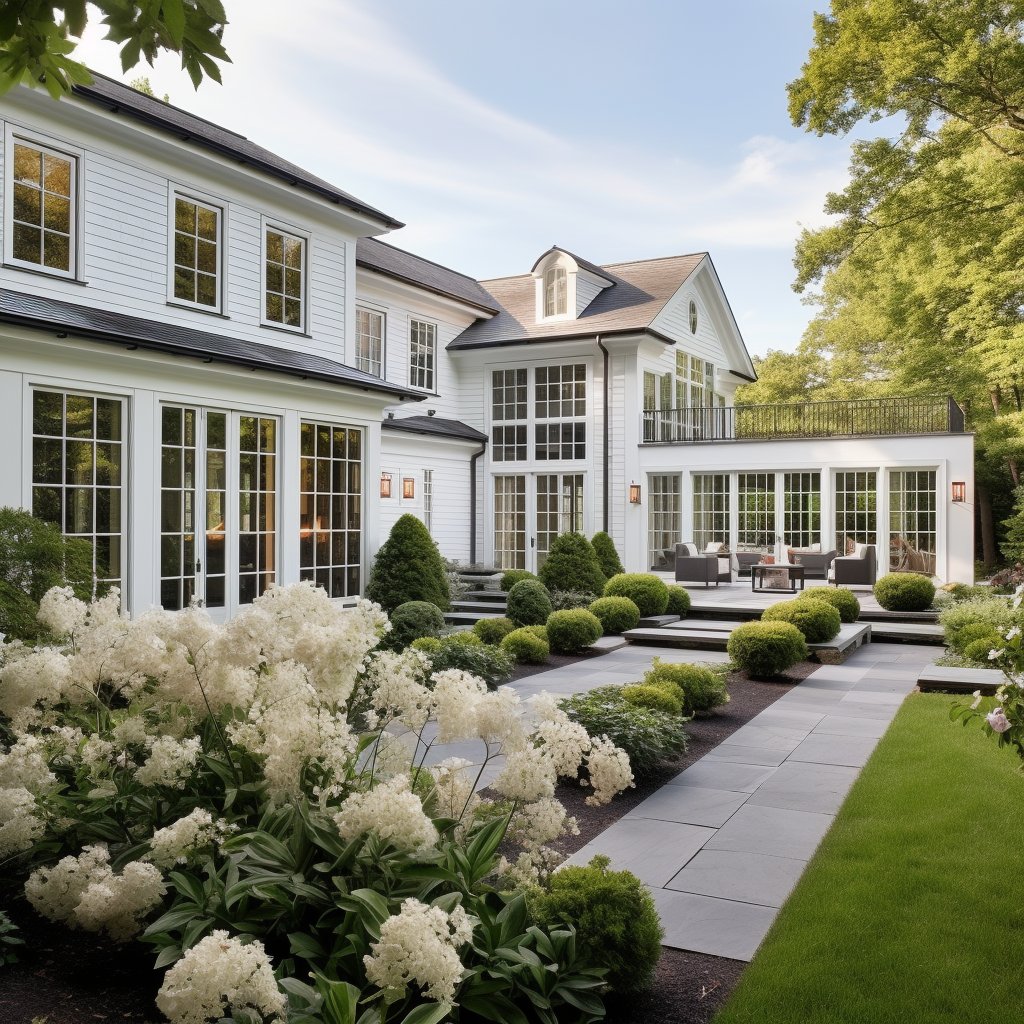
Austin Luxury Market Report: October 2026
Cody McConnell October 30, 2026
Cody McConnell October 30, 2026
By Cody McConnell, Realtor | Compass RE Texas, LLC
Austin's luxury market continued to see activity in October, particularly between $1 million and $2 million.
From October 1 through October 28, 66 single-family homes sold for $1 million or more across seven West Austin and Lake Travis reporting areas. The median sale price was $1,681,220, with homes spending a median of 51 days on the market.
What caught my attention was where those transactions were concentrated. Forty of the 66 sales closed below $2 million, while just ten reached $3 million or more.
That's an important distinction. A home priced at $1.2 million and an estate priced at $6 million may both fall into the luxury category, but they're not necessarily competing for the same buyers.
The differences become even more apparent when we look at the individual markets.
This report covers October 1 to October 28, 2026, rather than the full calendar month. All figures reflect closed transactions within the geographic and property-type filters described below.
Market Metric | October 1 to October 28, 2026 |
|---|---|
Closed single-family sales | 66 |
Median sale price | $1,681,220 |
Average sale price | Approximately $2,197,000 |
Median price per square foot | Approximately $491 |
Median days on market | 51 |
Median sale-to-final-list price ratio | 94.8% |
Lowest sale price | $1,035,000 |
Highest sale price | $8,750,000 |
Source: Unlock MLS (Matrix). Closed single-family residential sales of $1,000,000 or more in ZIP codes 78703, 78731, 78746, 78733, 78730, 78738 and 78734. Reporting period: October 1 to October 28, 2026. Median days on market is calculated from 63 transactions with recorded data. Data is deemed reliable but not guaranteed.
For this report, I'm using $1 million as the entry point for luxury. That includes a broad range of properties, so I find it helpful to separate the transactions into price brackets.
Sale Price | Closed Sales | Share of Sales |
|---|---|---|
$1M to under $2M | 40 | 60.6% |
$2M to under $3M | 16 | 24.2% |
$3M and above | 10 | 15.2% |
Total | 66 | 100% |
Most of October's transactions were closer to the entry point of the luxury market than the very top end.
That also helps explain the difference between the average and median sale prices. A relatively small number of multimillion-dollar transactions pushed the average above $2.19 million, while the median remained closer to $1.68 million.
Neither figure is inherently more important. They just describe different aspects of the market.
One statistic worth examining is the 94.8% median sale-to-final-list price ratio.
In simple terms, the median transaction closed at about 94.8% of its final asking price. But I wouldn't interpret that as an automatic 5.2% discount available to every buyer.
Some homes may have gone through price reductions before reaching their final asking price. The ratio also doesn't capture the full financial picture, including seller concessions or other negotiated terms.
For sellers, I'd pay attention to how your property compares with the homes buyers are considering right now. A beautifully updated home on a desirable lot may face very different competition than an older property requiring extensive renovation.
For buyers, the same principle applies. I'd want to understand how long a home has been listed, whether its price has changed, what comparable properties have sold for, and what alternatives are currently available.
The 51-day median marketing time provides additional context, but it doesn't tell us whether any particular home is overpriced. That requires looking at the property and its competition.
This is where the report becomes more useful.
West Lake Hills, Rollingwood, central Austin and the areas surrounding Lake Austin and Lake Travis are all premium residential markets. But their housing stock, lot characteristics, location and available inventory can differ significantly.
For this report, I've grouped the transactions into seven geographic reporting areas. They're based on the ZIP-code search and further divided by municipality and location, rather than treated as official MLS neighborhood boundaries.
Each transaction is assigned to one group.
Read the counts before you read the medians. A market with one or five closings can't be interpreted the same way as an area with more than twenty.
Reporting Area | Closed Sales | Median Sale Price | Sale Price Range |
|---|---|---|---|
West Lake Hills (city limits) | 6 | $2,219,600 | $1,375,000 to $4,110,375 |
Rollingwood (city limits) | 1 | Not reported, one sale | One transaction |
Central Austin / 78703 | 9 | $2,150,000 | $1,100,000 to $4,175,000 |
Northwest Austin / 78731 | 5 | $1,347,000 | $1,197,000 to $1,950,000 |
West Austin / 78746, excluding West Lake Hills and Rollingwood | 10 | $1,976,500 | $1,145,000 to $4,483,700 |
Lake Austin Corridor / 78730 to 78733, plus Mount Bonnell-area sale | 12 | $1,442,500 | $1,101,000 to $8,750,000 |
Lake Travis Area / 78734 to 78738 | 23 | $1,387,500 | $1,035,000 to $6,150,000 |
Total | 66 |
The table reports closed sales only, not the current supply of homes for sale. The areas are defined for this report and should not be interpreted as official neighborhood boundaries.
Six properties sold within the city limits of West Lake Hills, with a median price of $2,219,600.
West Lake Hills is a good example of why I prefer looking at individual properties rather than making broad assumptions from a monthly median. Lot size, topography, views, architectural quality and renovation needs can vary considerably.
Six closings give us a useful snapshot of the month's activity, but not enough to declare that the broader market has moved in one direction or another.
For additional context, I would also examine competing properties in nearby portions of 78746, while keeping the city boundaries clear.
Rollingwood recorded one qualifying sale.
That single closing is the month's activity by definition, but it doesn't establish a meaningful neighborhood pricing trend.
Rollingwood has a relatively limited housing stock, and individual properties can differ considerably in age, lot characteristics and construction quality. One transaction simply isn't enough to generalize about the entire market.
For anyone considering buying or selling here, I'd look beyond October and examine recent comparable sales, current competition and pricing history.
You can also explore my Rollingwood neighborhood guide.
Nine homes sold for $1 million or more in ZIP code 78703, with a median sale price of $2,150,000.
This includes Tarrytown and several other established central Austin neighborhoods. It's important not to confuse the ZIP code with any one neighborhood.
The homes, lots and price points found in Tarrytown can be quite different from those in Pemberton Heights or Clarksville. A 78703 median is useful for understanding broader activity, but individual neighborhood comparisons are more relevant when evaluating a specific property.
I've covered that distinction in greater detail in my Tarrytown neighborhood guide.
Five transactions were assigned to the Northwest Austin reporting area, with a median sale price of $1,347,000.
This group primarily reflects properties in 78731, with one Mount Bonnell-area transaction assigned to the Lake Austin category instead.
That distinction is deliberate. ZIP codes are useful search boundaries, but they don't always follow the way buyers think about individual neighborhoods.
With only five transactions in this category, I'd be cautious about drawing broader conclusions about pricing or demand from the median alone.
Ten Austin-addressed properties in 78746, outside the city limits of West Lake Hills and Rollingwood, closed at a median of $1,976,500.
This reporting area includes properties associated with Barton Creek, Rob Roy and other portions of West Austin.
One of the challenges with comparing this market is the variety of properties. Lot sizes, hillside locations, views, architectural styles and levels of renovation can differ significantly.
For buyers and sellers, that makes the actual competitive set more important than the ZIP-code median. Two properties with similar square footage may appeal to different buyers depending on their location and overall features.
The Lake Austin reporting area recorded 12 closed sales, with a median price of $1,442,500.
This group includes properties in 78730 and 78733, along with a Mount Bonnell-area transaction assigned from 78731.
The sale prices ranged from $1,101,000 to $8,750,000, the widest spread among the seven reporting areas.
That range is a reminder of how varied the housing stock can be. Homes with waterfront characteristics, unusual acreage, or extensive improvements may have little in common with other properties in the same broader reporting area.
For that reason, I'd use the overall median as context rather than as the basis for valuing an individual home.
The Lake Travis reporting area accounted for 23 sales, the largest share of the seven markets covered.
The median sale price was $1,387,500, with transactions ranging from $1,035,000 to $6,150,000.
This group covers 78734 and 78738, including properties in Lakeway, Bee Cave, The Hills and surrounding Austin-addressed communities.
It's a diverse area. Buyers may be comparing custom homes, larger lots, newer construction and properties with different levels of access to Lake Travis and nearby amenities.
With 23 closed transactions, this group gives us more monthly observations than the smaller markets, although individual property characteristics still matter when interpreting the results.
The clearest takeaway is that most of the recorded activity in these luxury reporting areas occurred below $2 million.
That doesn't mean demand for higher-priced properties has disappeared. Ten homes closed at $3 million or more during the reporting period, including transactions at substantially higher price points.
What it does show is that the $1 million-plus market covers several different segments, and one median doesn't describe them all particularly well.
I would also be careful about treating October as evidence of a larger market trend. We're looking at a partial month of closed sales, without an equivalent prior-period comparison or a measure of current inventory. Future monthly editions of this report will use the same ZIP codes, single-family classification and $1 million threshold, and ideally a complete calendar month. A partial-month report should not be compared directly with a full-month report without noting that difference.
For a seller, the practical question is how your home competes with available listings and recent comparable sales.
For a buyer, it's whether the property you're considering is priced appropriately relative to its alternatives.
That's where I'd focus the conversation.
I'm using $1 million as the starting point so we can track activity across a consistent group of West Austin and Lake Travis markets.
That doesn't mean a $1.1 million home competes directly with a $5 million estate. That's why I've separated the sales into price ranges and individual reporting areas.
Keeping the same criteria in future reports will also make comparisons more meaningful.
Use the report to understand the broader market, not to determine your home's value from a median.
For an individual property, I'd look at recent comparable sales, active listings, condition, lot characteristics, location, and the features buyers are willing to pay for.
Those details matter far more than whether the broader reporting area had a higher or lower median in a particular month.
If you're considering buying or selling in West Lake Hills, Rollingwood, Tarrytown, Northwest Austin, or the Lake Austin and Lake Travis areas, I'd start by looking at the properties you're actually competing with.
The broader numbers help establish context. The individual properties are what shape a good pricing or offer strategy.
For homeowners, I can prepare a property-specific home valuation based on current competition, recent sales and the characteristics of your home.
If you're buying, we can review individual opportunities, pricing history and the market conditions surrounding the properties you're considering.
Call or text me at 512-559-8619, or reach out to discuss your plans.
Cody McConnell
Realtor | Compass RE Texas, LLC
512-559-8619
Texas Real Estate Commission Information About Brokerage Services | Texas Real Estate Commission Consumer Protection Notice
About the Author
Cody McConnell is a Realtor with Compass RE Texas, LLC, serving buyers and sellers throughout the Austin metropolitan area. His work includes residential real estate, luxury property marketing, and helping clients evaluate market conditions, property values and buying or selling strategies.
Archive: Previous monthly reports will appear here as the series develops.
Stay up to date on the latest real estate trends.
Work with a dedicated real estate professional who prioritizes strategy, service, and results. Cody delivers a seamless and elevated experience from start to finish. Contact Cody today to start your real estate journey!